I am presently working on my book; Profit In Up Or Down Markets, and have many pieces of the puzzle that show a recession is on the horizon. This post will give you an idea of what’s coming and some of you who are in stocks have some decisions to make.
The reasons to own gold and keep buying the dips become obvious, especially if you have read my thoughts on Exter’s Pyramid. Money flows to safety and that’s why we have seen treasuries so strong, and to gold and silver. This is just the beginning. Look at the very last chart on how it all ends and you’ll see why I have written about these types of warnings, now confirmed by others like Raoul Pal, a former Goldman Sachs hedge fund manager.
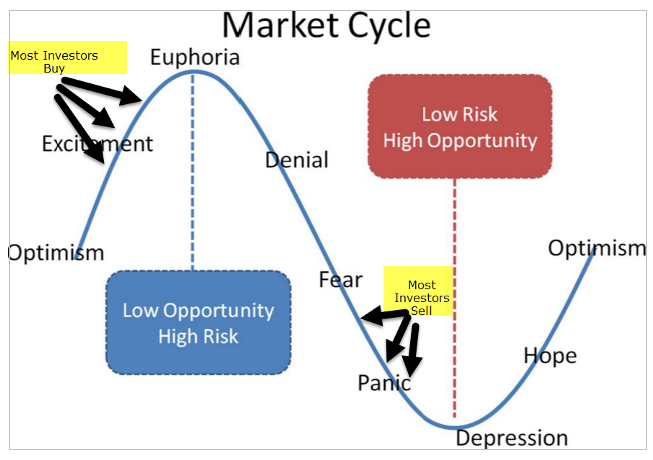
Where Are We In the Market Cycle?
My take is we are most likely still in the Excitement stage, but some bears would probably say we are in Euphoria. To get to Euphoria, you need more bears to capitulate on some further big moves higher. We are not seeing that with a slow grind higher.
So to get more bears on board, a pullback is in order, and then a whipsaw higher. The recession wouldn’t come until we get that price action possibly one last time, but if you read this article to its conclusion, it may not turn out that way. We very well could get the turn down now if you look at the global picture which isn’t pretty. Gold is already hitting new highs in most other currencies. And Latin America isn’t better. The Argentine Peso is crashing and the Colombian Peso isn’t doing too well. We already know Venezuela is a lost cause.
Jill Mislinski from Advisor Perspectives concurs with her inflation-adjusted S&P 500 index price that shows it is 112% above its long-term trend line dating back to 1871. This is 31% higher than just 3 years ago and now above the 2000 high. Just one more sign we are overvalued.

Inverted Yield Curve
The big talk yesterday was about the Inverted Yield Curve. Why is it important? Because it is the first signal to show a recession is on the way.

WHY DOES INVERSION MATTER? Yield curve inversion is a classic signal that a recession is coming. The U.S. curve has inverted before each recession in the past 50 years. It offered a false signal just once in that time. When short-term yields climb above longer-dated ones, it signals short-term borrowing costs are more expensive than longer-term loan costs. Under these circumstances, companies often find it more expensive to fund their operations and executives tend to temper or shelve investments. Consumer borrowing costs also rise and consumer spending, which accounts for more than two-thirds of U.S. economic activity, slows. The economy eventually contracts and unemployment rises. HOW SOON DOES RECESSION OCCUR AFTER THE CURVE INVERTS? The economy has taken anywhere from 12 months to 24 months to fall into recession when the yield curve inverts. Also, the curve’s inversion often ends before a recession begins. A yield curve inversion has no power to predict the length or severity of a downturn.
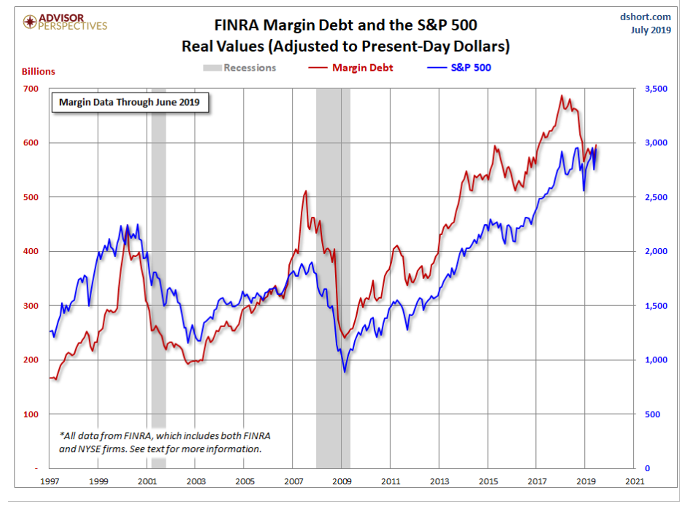
Margin Debt
In 2016 I wrote that many talk about margin debt as a reason to be worried about stock market valuations, and for good reason. In 2013 we hit record highs in margin debt, and in 2015 we were near record highs still. I wrote that while the stock market can be irrational longer than you can be solvent. Look at the chart now and see where the margin debt topped out. 40% higher than the top during the last financial crisis. This doesn’t mean we have topped out yet, but this is another area to keep an eye on if you are looking for tops and a reason to bail on the buy and hold strategy. At a minimum, it tells us to lock in profit with the assumption that we discussed already, that about every 9 years a recession looms.
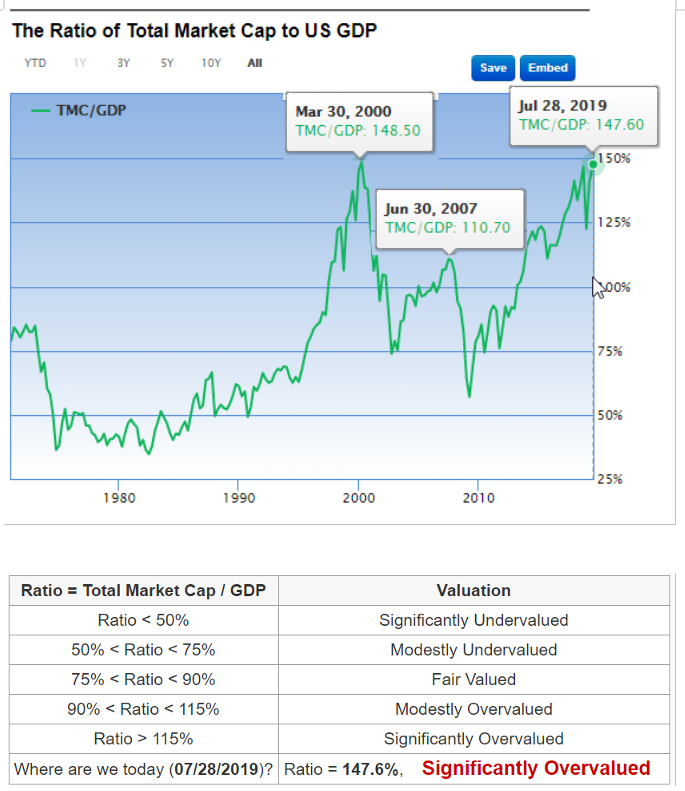
Market Valuations
One way to see whether today’s stock market is undervalued or overvalued is to compare the market cap to GDP. According to Gurufocus, “The Total Market Index is at $ 31,086 billion, up about10,200 billion since 2016 and the ratio of market cap to GDP is at 147% , just under the March 2000 high of 148.5% and well above the pre-2007-2009 crisis high of 110.70. This is another signal of a market potentially topping soon.
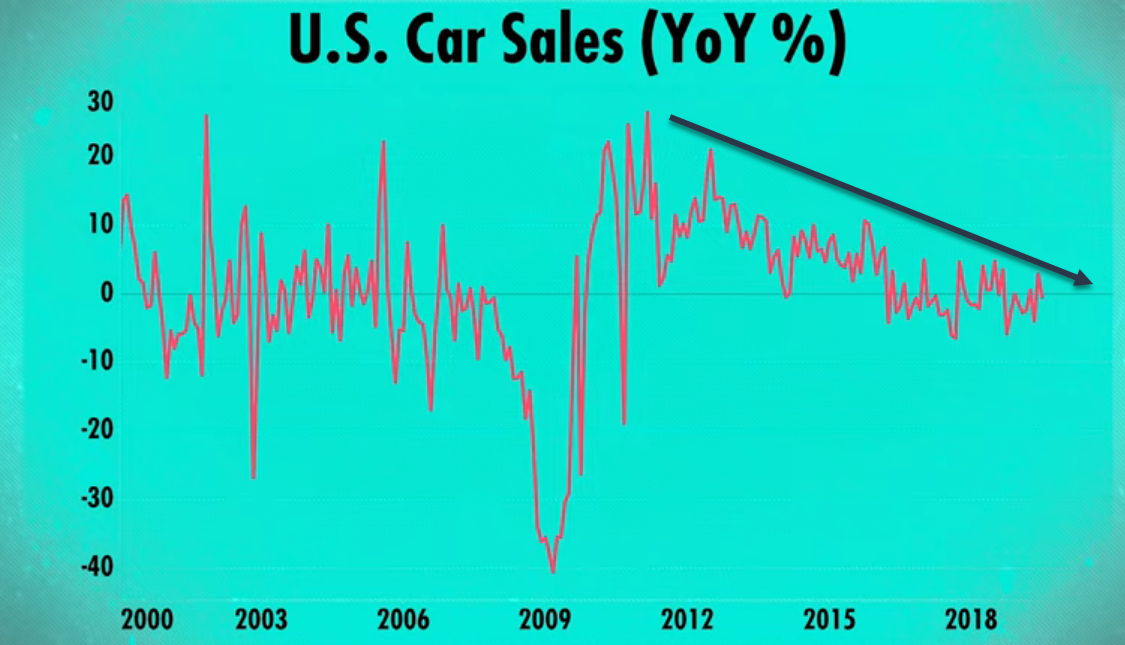
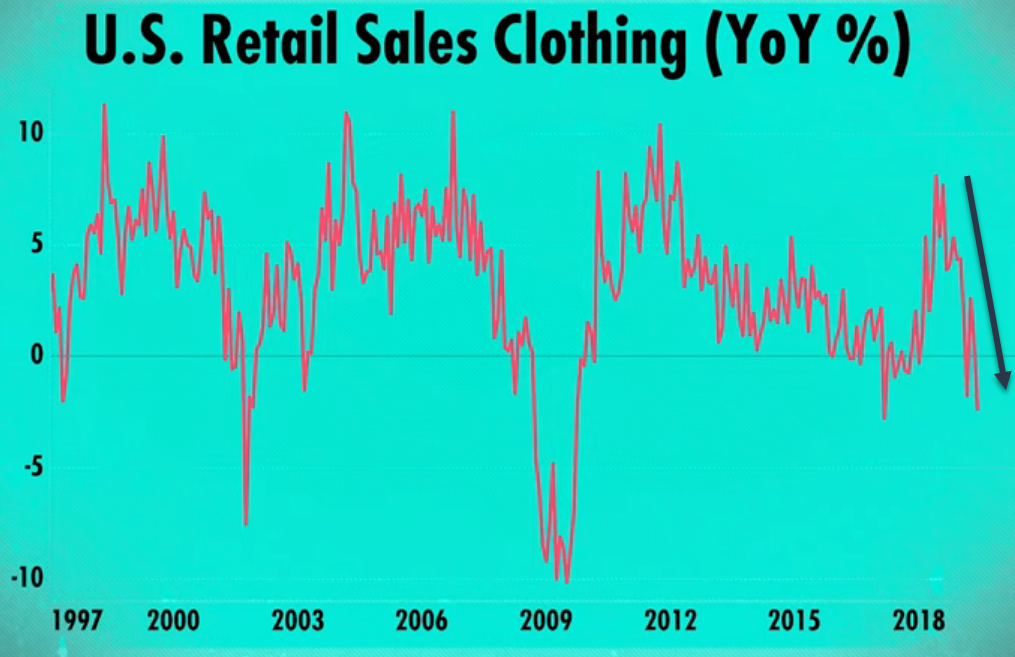
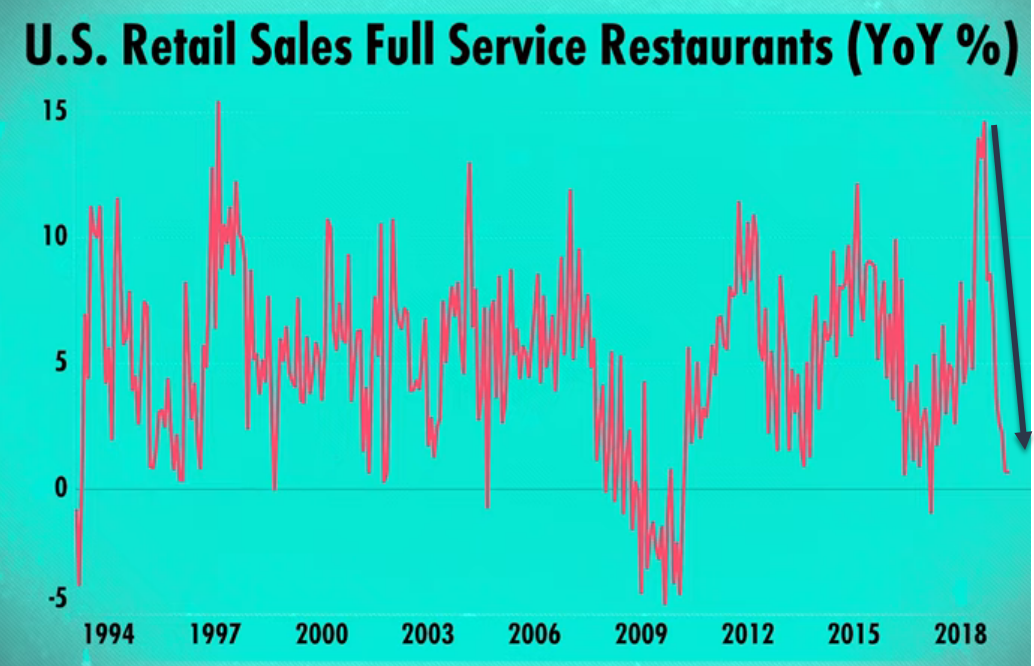
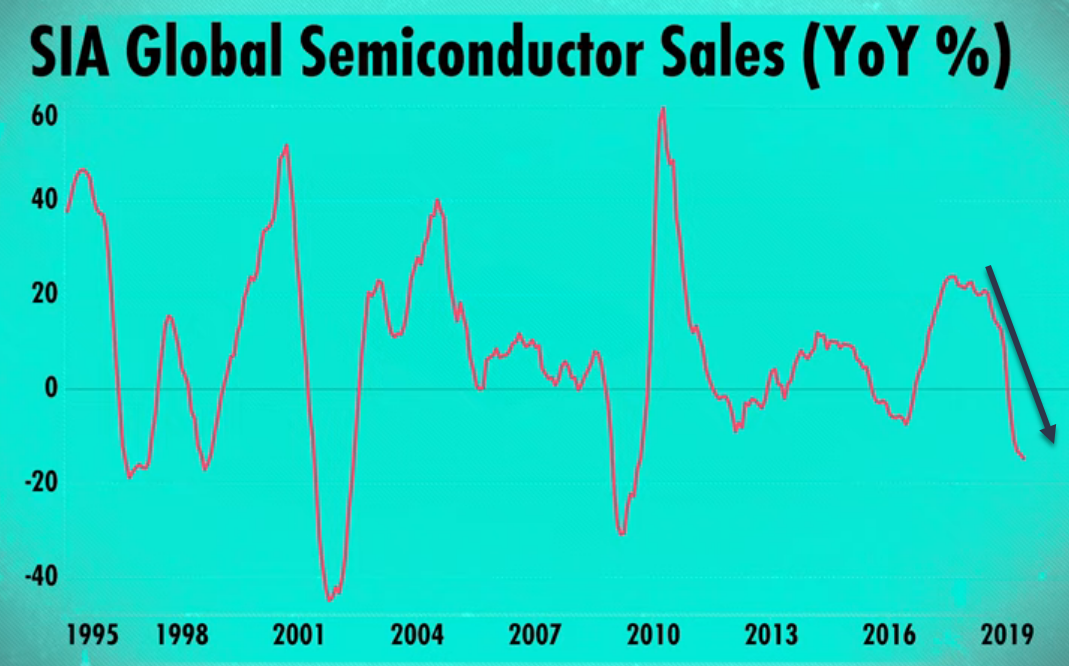
What Does the Data Tell Us?
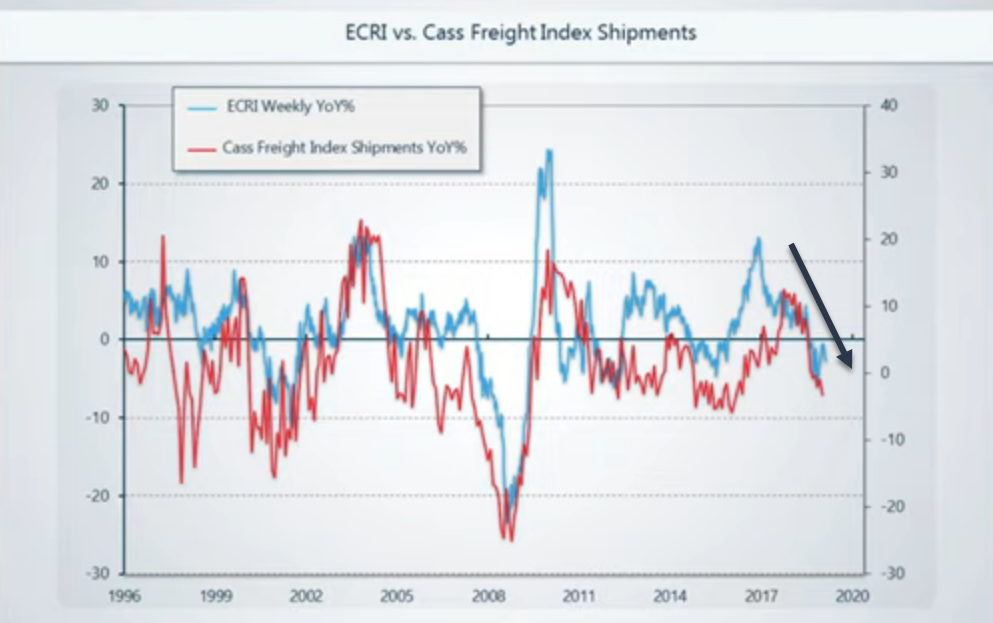
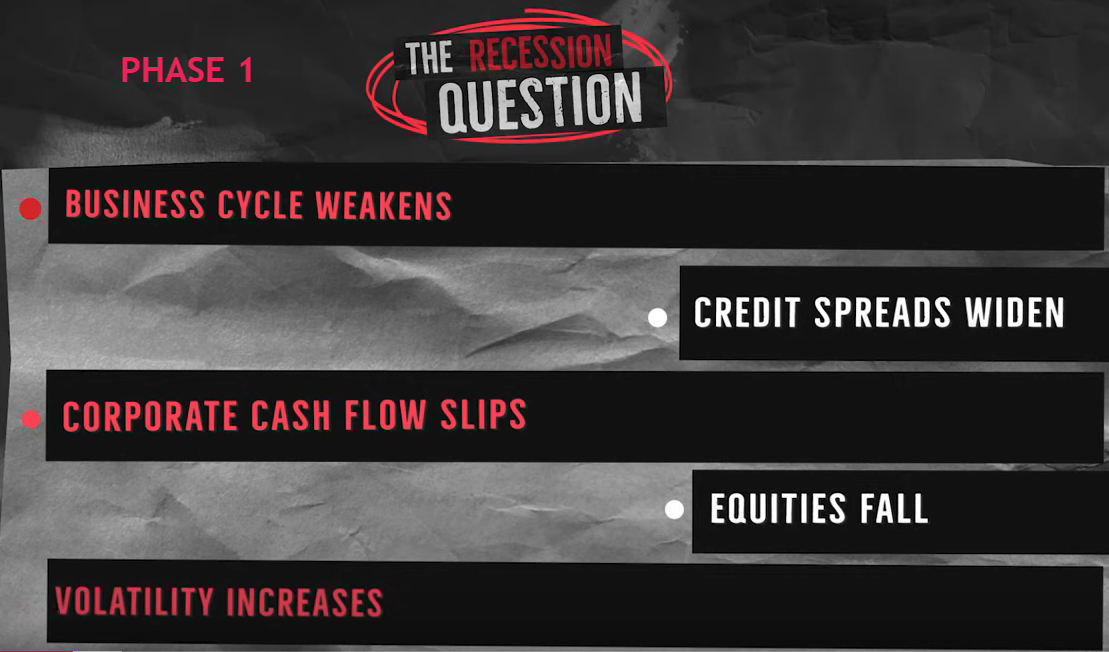
The stock markets have fallen and things look a bit ugly, but the Trump tariff war is getting the blame. More than likely the blame goes to the Fed for easy money policy and now seeing the reversal of it with liquidity tightening. While we remain volatile, for now the overall direction is down and any bounces in the market can be shorted. They will be short lived. Wherever the blame, Raoul Pal does a marvelous job of explaining the 3 stages of a recession. We are presently in Stage 1 he says. But look at the data he provides leading up to his conclusions. Fits right in with my deflationary credit contraction narrative. Sooner or later, data matters.


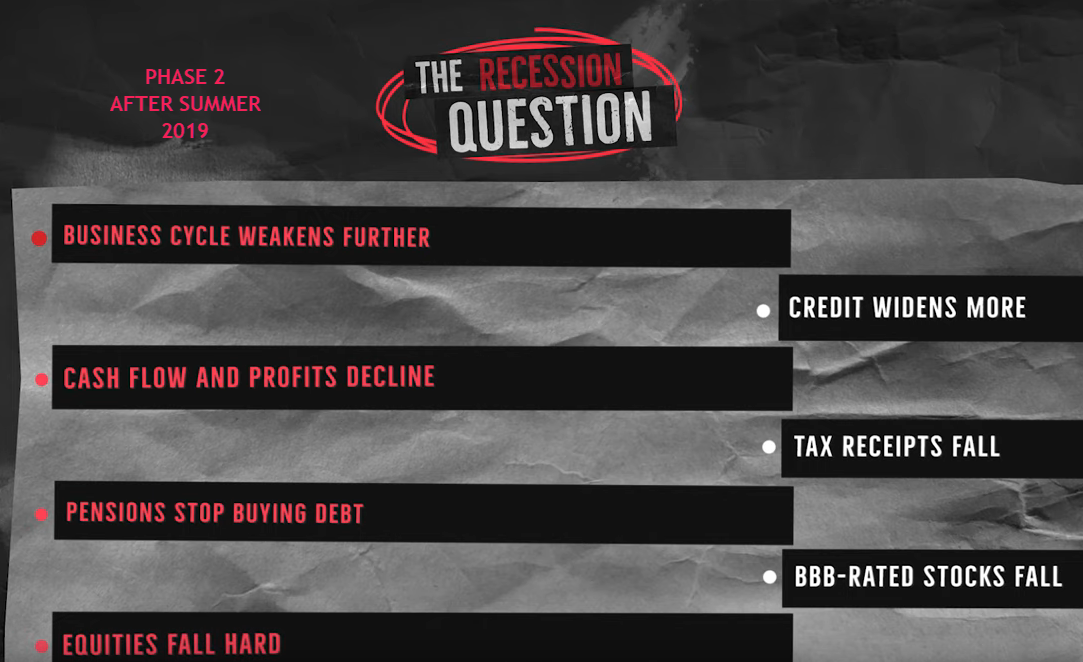
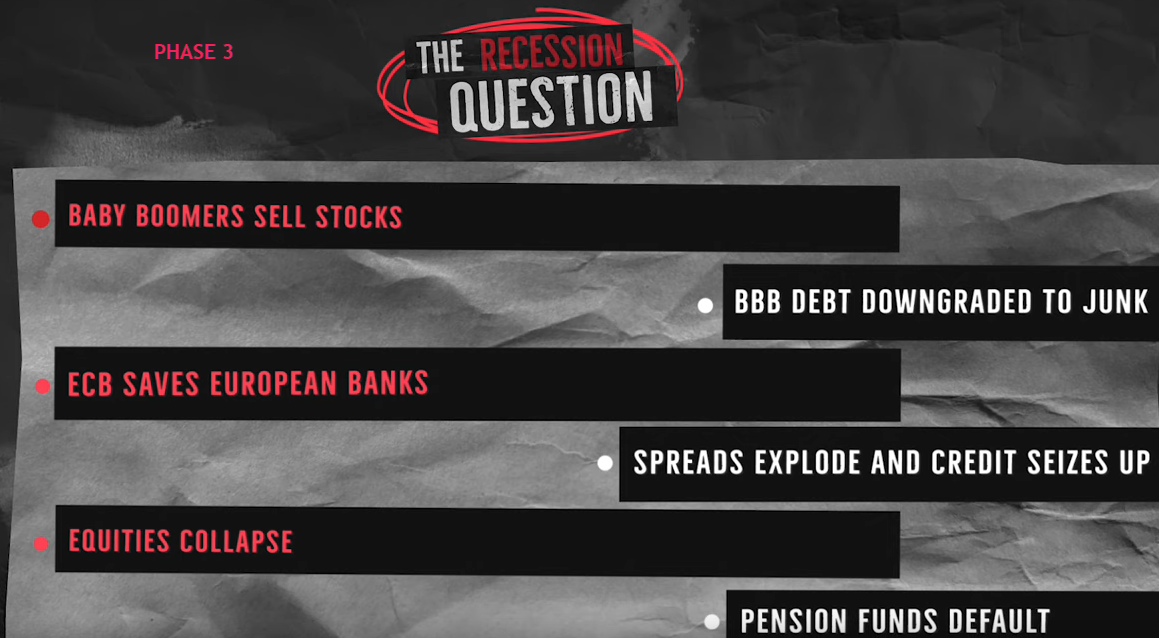
The 3 Phases of a Recession
We are presently in Phase 1. Most who are in Index Funds will have suffered greatly by Phase 3. Gold and silver will shine.
Related posts

Doug Eberhardt is a 28 year financial services veteran and precious metals broker selling gold and silver at 1% over wholesale cost. Doug has written a book to help investors understand how gold and silver fit into a diversified portfolio, how to buy gold and silver, and what metals to buy. The book; “Buy Gold and Silver Safely” is available by clicking here Contact phone number for Buy Gold and Silver Safely is 888-604-6534
Disclosure:
Commodity Futures Trading Commission Futures and Options trading has large potential rewards, but also large potential risk. You must be aware of the risks and be willing to accept them in order to invest in the futures and options markets. Don’t trade with capital you can’t afford to lose. This is neither a solicitation nor an offer to Purchase/Sell futures or options. No representation is being made that any account will or is likely to achieve gains or losses similar to those discussed in this outlook. The past track record of any trading system or methodology is not necessarily indicative of future results.
All trades, patterns, charts, systems, etc. discussed in this outlook and the product materials are for illustrative purposes only and not to be construed as specific advisory recommendations. All ideas and material presented are entirely those of the author.